> ## Documentation Index
> Fetch the complete documentation index at: https://docs.primeintellect.ai/llms.txt
> Use this file to discover all available pages before exploring further.
# Cluster Monitoring
> Detect issues early and minimize downtime with production-ready monitoring
 ## Overview
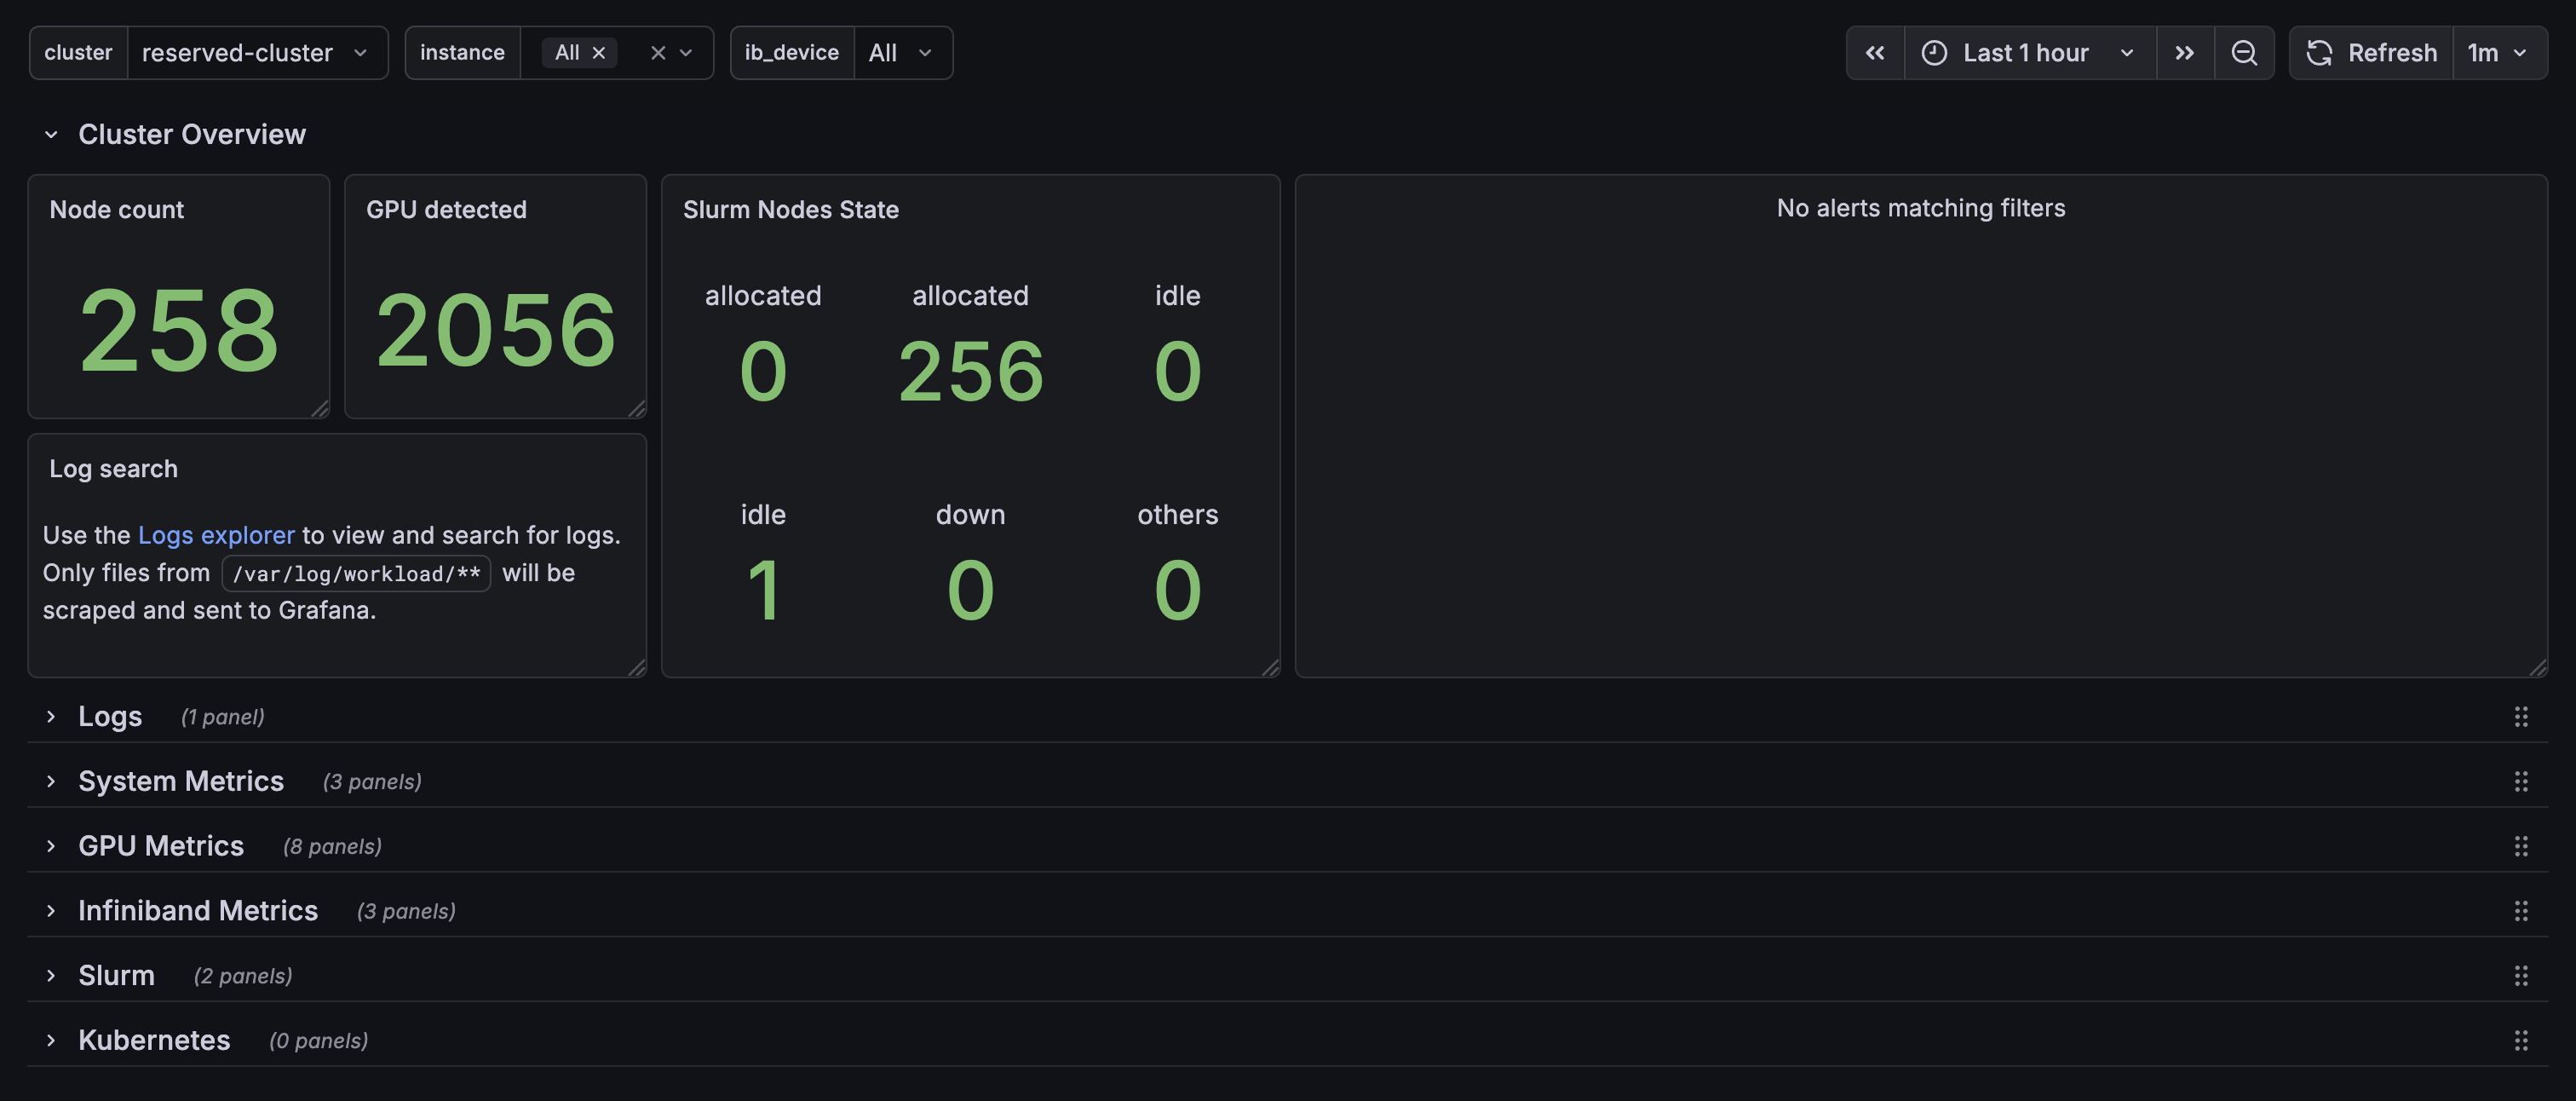
Reserved clusters come with production-ready monitoring out of the box—no setup required. Our monitoring is built to meet the [ClusterMAX™](https://www.clustermax.ai/monitoring) standard, the industry benchmark for GPU cloud infrastructure developed by SemiAnalysis.
Detect hardware issues early, minimize downtime, and keep your training runs on track with:
* **Preconfigured Grafana dashboards** covering critical GPU, node, and network metrics
* **Proactive alerting** delivered to your preferred channels the moment issues arise
* **GPU health monitoring** including XID error detection and hardware anomaly tracking
## Accessing the Dashboard
Your cluster includes a Grafana dashboard for visualizing metrics. Access is provided during the cluster handover process—once your reserved cluster is ready, you will receive the dashboard URL and credentials from the Prime Intellect team.
## Available Metrics
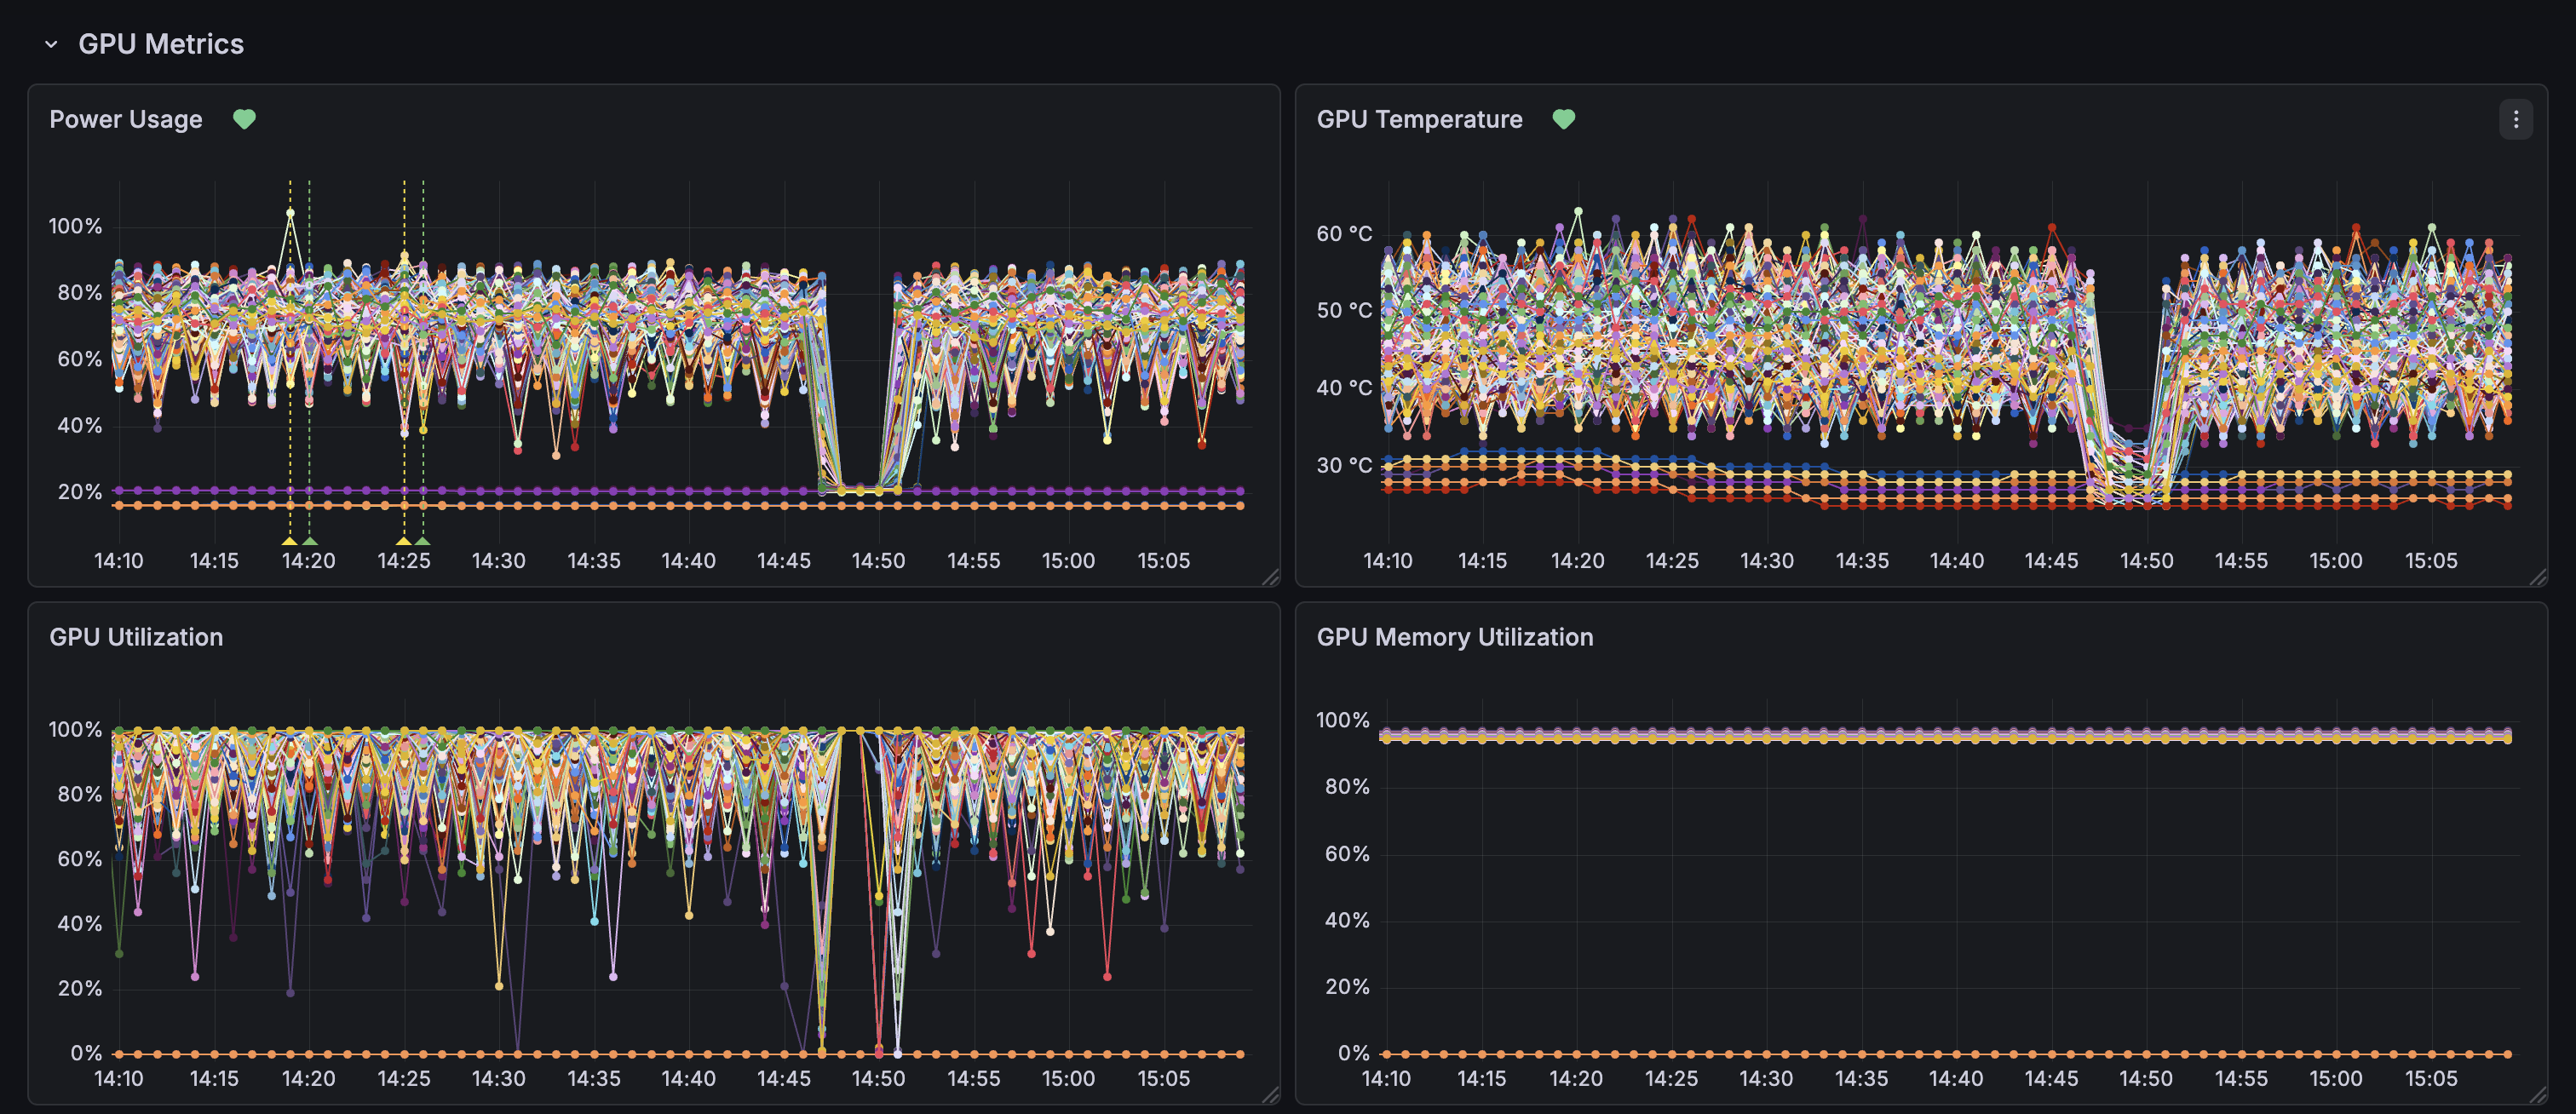
The monitoring dashboard includes preconfigured graphs for critical metrics across your cluster:
| Category | Metrics | Source |
| ---------- | ------------------------------------------------------------------------------------- | --------------------------------------------------------------------- |
| GPU | Utilization, memory, temperature, power usage, interconnect throughput (PCIe, NvLink) | [DCGM Exporter](https://github.com/NVIDIA/dcgm-exporter) |
| Node | CPU, memory, disk, and network usage | [Node Exporter](https://github.com/prometheus/node_exporter) |
| InfiniBand | Throughput, port errors, and discards | [Node Exporter](https://github.com/prometheus/node_exporter) |
| Slurm | Node states, cluster utilization, and running jobs | [Slurm Exporter](https://github.com/PrimeIntellect-ai/slurm-exporter) |
## Overview
Reserved clusters come with production-ready monitoring out of the box—no setup required. Our monitoring is built to meet the [ClusterMAX™](https://www.clustermax.ai/monitoring) standard, the industry benchmark for GPU cloud infrastructure developed by SemiAnalysis.
Detect hardware issues early, minimize downtime, and keep your training runs on track with:
* **Preconfigured Grafana dashboards** covering critical GPU, node, and network metrics
* **Proactive alerting** delivered to your preferred channels the moment issues arise
* **GPU health monitoring** including XID error detection and hardware anomaly tracking
## Accessing the Dashboard
Your cluster includes a Grafana dashboard for visualizing metrics. Access is provided during the cluster handover process—once your reserved cluster is ready, you will receive the dashboard URL and credentials from the Prime Intellect team.
## Available Metrics
The monitoring dashboard includes preconfigured graphs for critical metrics across your cluster:
| Category | Metrics | Source |
| ---------- | ------------------------------------------------------------------------------------- | --------------------------------------------------------------------- |
| GPU | Utilization, memory, temperature, power usage, interconnect throughput (PCIe, NvLink) | [DCGM Exporter](https://github.com/NVIDIA/dcgm-exporter) |
| Node | CPU, memory, disk, and network usage | [Node Exporter](https://github.com/prometheus/node_exporter) |
| InfiniBand | Throughput, port errors, and discards | [Node Exporter](https://github.com/prometheus/node_exporter) |
| Slurm | Node states, cluster utilization, and running jobs | [Slurm Exporter](https://github.com/PrimeIntellect-ai/slurm-exporter) |
 ## Troubleshooting with the Dashboard
When a training job fails, use the dashboard to quickly identify the root cause. In large clusters, alerts eliminate the need to manually hunt for the bad node—they tell you exactly which node and device has the issue.
### 1. Check XID Alerts First
Start with the **Alert list** in the Cluster Overview. XID alerts identify the exact node and GPU device experiencing issues, so you can pinpoint problems immediately without searching through hundreds of nodes.
XID errors are NVIDIA's GPU error codes reported by the kernel driver. Each code indicates a specific hardware or software issue—from memory errors to thermal shutdowns. Use the [NVIDIA XID Error Catalog](https://docs.nvidia.com/deploy/xid-errors/index.html) to look up the error code and understand the recommended action.
### 2. Check InfiniBand Performance
Next, expand the **InfiniBand Metrics** section and look for:
* **Port Errors** - Non-zero values indicate connectivity problems
* **Throughput drops** - May explain slow collective operations during distributed training
### 3. Review Secondary Metrics
For additional context, check:
* **GPU Temperature** - Spikes above 80°C may indicate cooling issues
* **GPU Utilization** - Sudden drops to 0% during training suggest failures
* **Slurm Nodes State** - See if any nodes are marked as "down"
### Adjust Time Range
Use the time picker (top right) to zoom into the incident window or compare with historical baseline.
## Alerting
Get notified immediately when something needs attention. Alerts are triggered when metrics exceed critical thresholds, so you can respond before issues impact your workloads.
### Notification Channels
Alerts can be delivered to your preferred channels:
* **Slack** - Receive alerts directly in your Slack workspace
* **Microsoft Teams** - Get notifications in your Teams channels
* **Webhooks** - Integrate with any provider that accepts webhooks
To configure your notification channel, contact the Prime Intellect team with your preferred destination.
Your cluster comes with battle-tested alert rules based on our experience operating large-scale GPU clusters.
### Creating Custom Alerts
You can create custom alert rules directly in Grafana for your specific workloads. Here's how:
In your Grafana dashboard, navigate to **Alerting** → **Alert rules** → **+ New alert rule**.
Select your data source and write a query for the metric you want to monitor. Then set the condition that triggers the alert (e.g., `GPU temperature > 80°C`).
Configure how often the rule is evaluated and how long the condition must be true before firing. This helps prevent false alarms from brief spikes.
Choose where to send alerts—use an existing contact point (Slack, Teams, webhook) or create a new one.
Click **Save rule** to activate your custom alert.
For detailed documentation, see the [Grafana Alerting guide](https://grafana.com/docs/grafana/latest/alerting/alerting-rules/create-grafana-managed-rule/).
## Troubleshooting with the Dashboard
When a training job fails, use the dashboard to quickly identify the root cause. In large clusters, alerts eliminate the need to manually hunt for the bad node—they tell you exactly which node and device has the issue.
### 1. Check XID Alerts First
Start with the **Alert list** in the Cluster Overview. XID alerts identify the exact node and GPU device experiencing issues, so you can pinpoint problems immediately without searching through hundreds of nodes.
XID errors are NVIDIA's GPU error codes reported by the kernel driver. Each code indicates a specific hardware or software issue—from memory errors to thermal shutdowns. Use the [NVIDIA XID Error Catalog](https://docs.nvidia.com/deploy/xid-errors/index.html) to look up the error code and understand the recommended action.
### 2. Check InfiniBand Performance
Next, expand the **InfiniBand Metrics** section and look for:
* **Port Errors** - Non-zero values indicate connectivity problems
* **Throughput drops** - May explain slow collective operations during distributed training
### 3. Review Secondary Metrics
For additional context, check:
* **GPU Temperature** - Spikes above 80°C may indicate cooling issues
* **GPU Utilization** - Sudden drops to 0% during training suggest failures
* **Slurm Nodes State** - See if any nodes are marked as "down"
### Adjust Time Range
Use the time picker (top right) to zoom into the incident window or compare with historical baseline.
## Alerting
Get notified immediately when something needs attention. Alerts are triggered when metrics exceed critical thresholds, so you can respond before issues impact your workloads.
### Notification Channels
Alerts can be delivered to your preferred channels:
* **Slack** - Receive alerts directly in your Slack workspace
* **Microsoft Teams** - Get notifications in your Teams channels
* **Webhooks** - Integrate with any provider that accepts webhooks
To configure your notification channel, contact the Prime Intellect team with your preferred destination.
Your cluster comes with battle-tested alert rules based on our experience operating large-scale GPU clusters.
### Creating Custom Alerts
You can create custom alert rules directly in Grafana for your specific workloads. Here's how:
In your Grafana dashboard, navigate to **Alerting** → **Alert rules** → **+ New alert rule**.
Select your data source and write a query for the metric you want to monitor. Then set the condition that triggers the alert (e.g., `GPU temperature > 80°C`).
Configure how often the rule is evaluated and how long the condition must be true before firing. This helps prevent false alarms from brief spikes.
Choose where to send alerts—use an existing contact point (Slack, Teams, webhook) or create a new one.
Click **Save rule** to activate your custom alert.
For detailed documentation, see the [Grafana Alerting guide](https://grafana.com/docs/grafana/latest/alerting/alerting-rules/create-grafana-managed-rule/).